Case study · Maps & open data
Indian Pixel City: all of Gandhinagar, drawn building by building
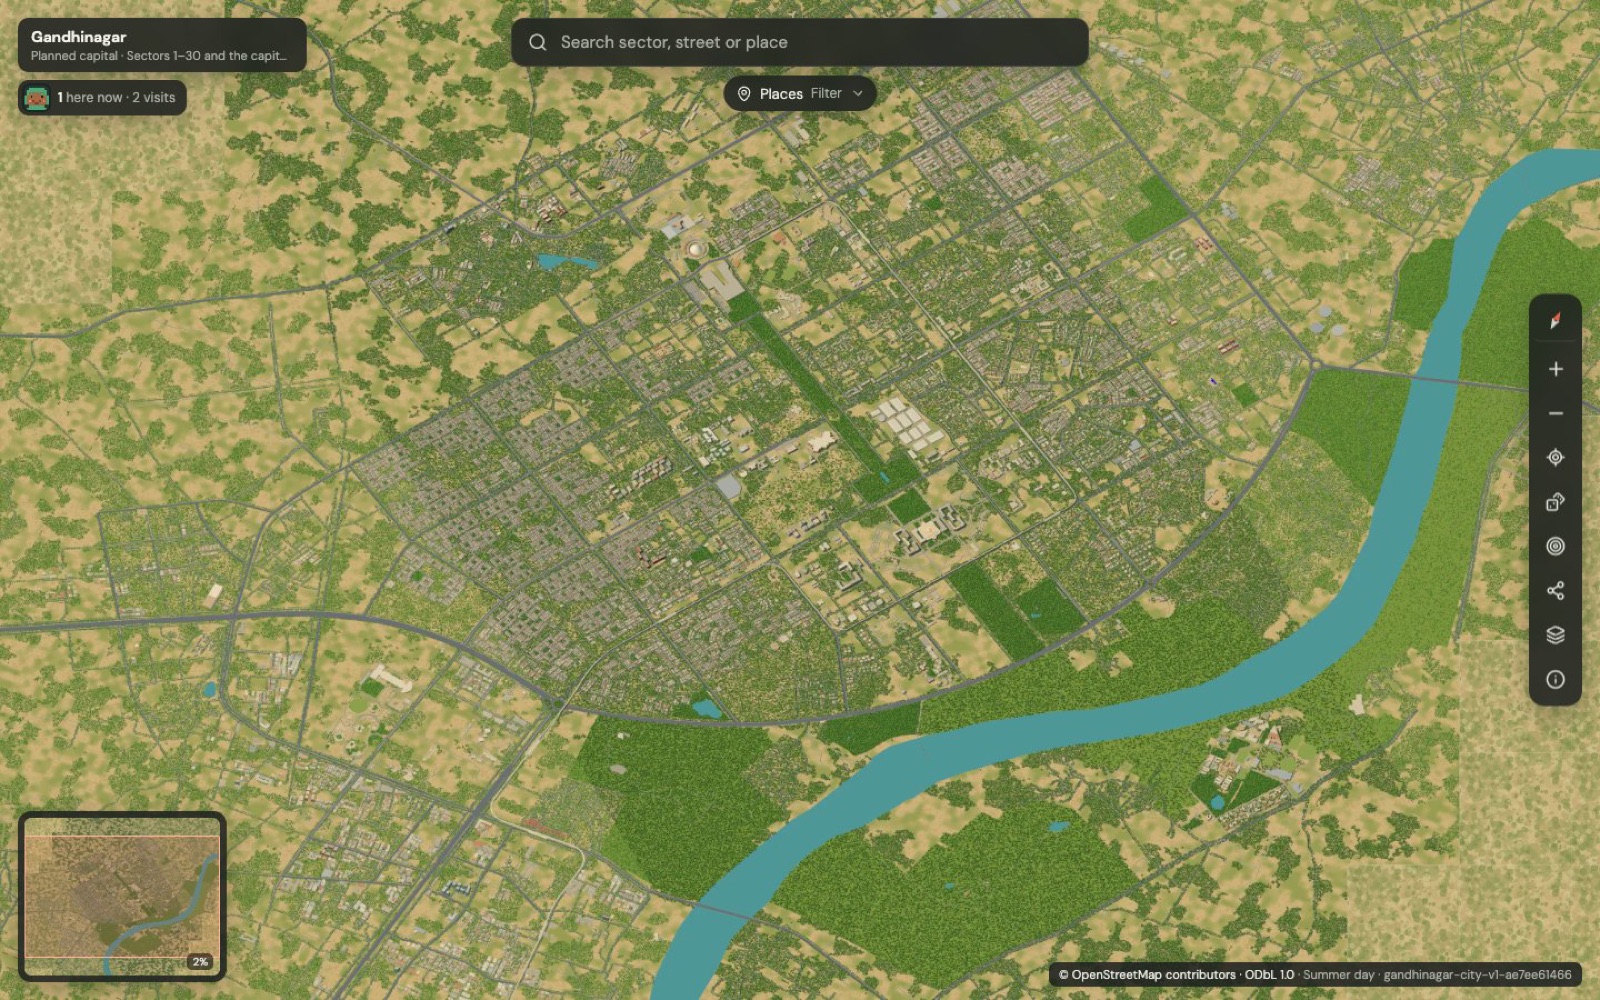
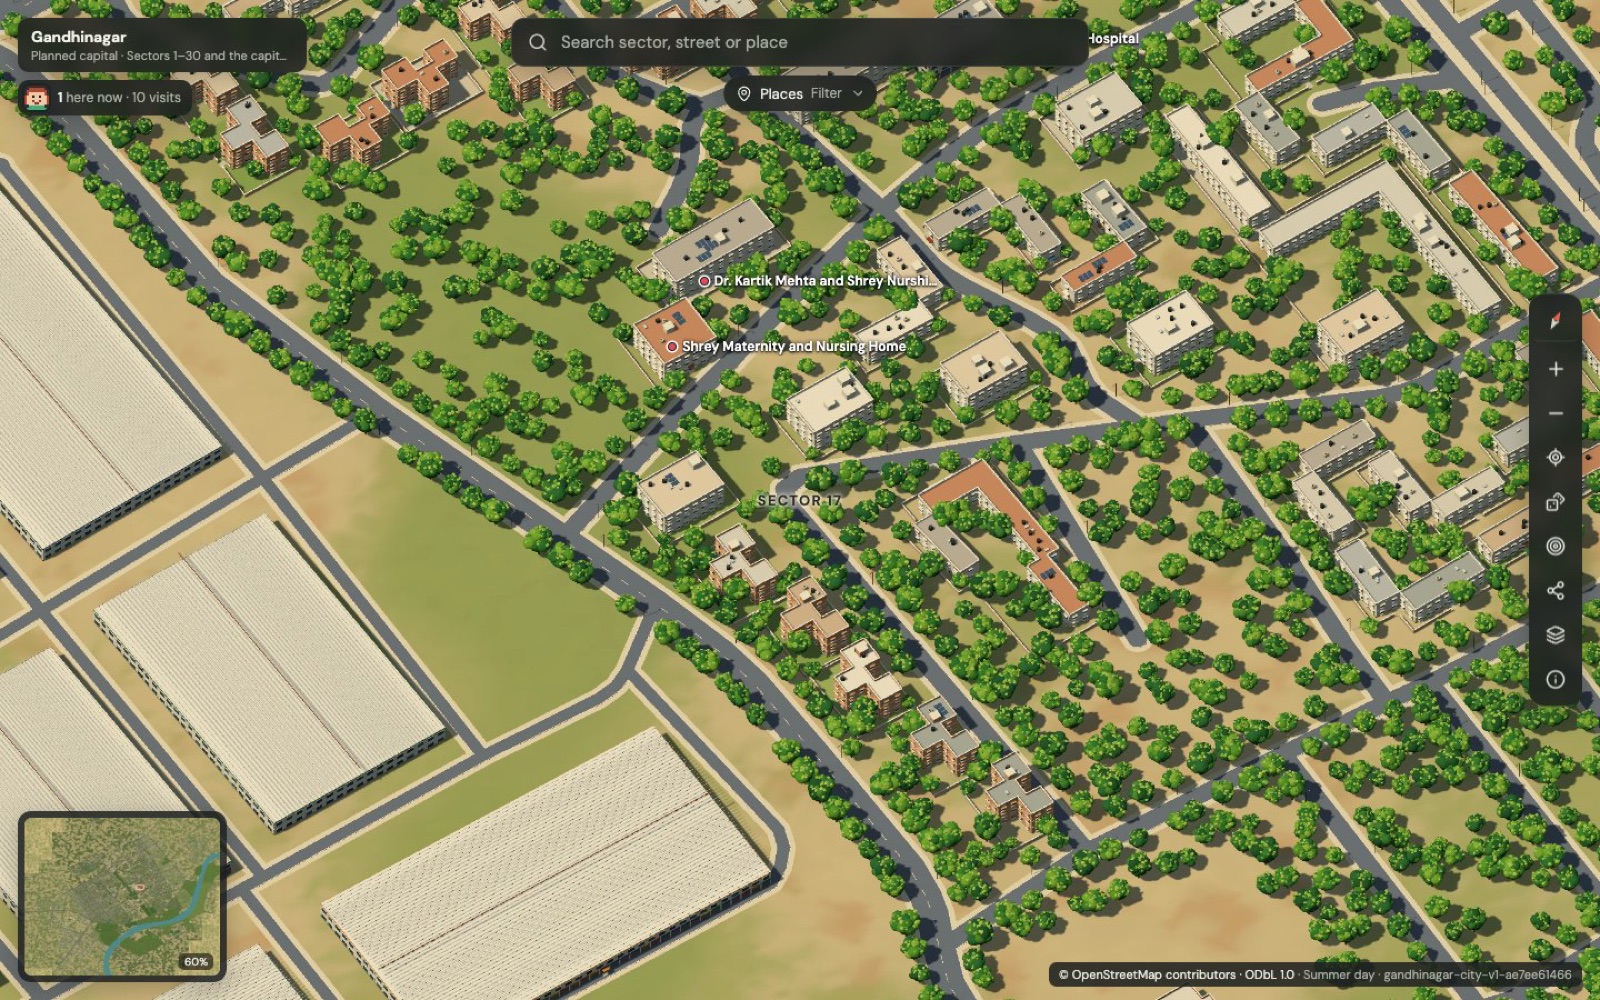
An illustrated, explorable map of Gujarat's capital, built from open data. 25,969 buildings across 61 km², four times and climates, living night traffic, and search for every hospital, school and metro station.
- Our role
- Concept, pipeline, build
- Area
- 61 km², Sectors 1–30
- Buildings
- 25,969, all of OSM
- Image size
- 2.75 gigapixels
- Places
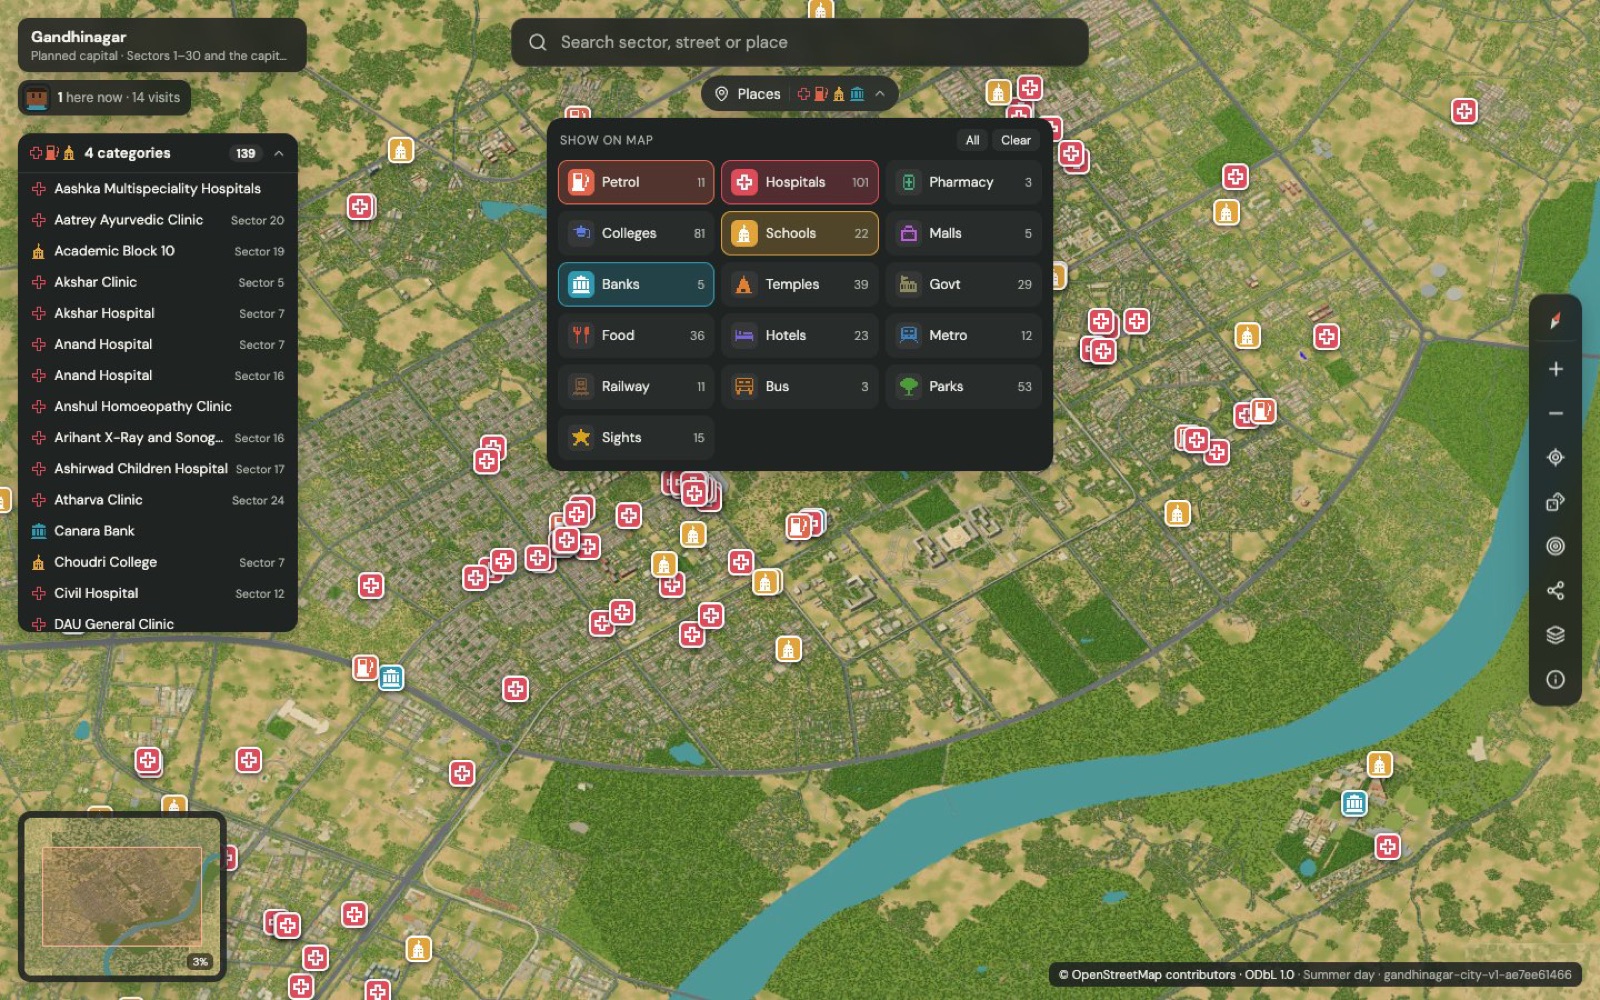
- 755 searchable, 16 filters
- Status
- Live, open source
Inside the map
In short
The goal: turn open map data into an illustrated, explorable picture of a whole Indian city, rendered on a laptop and accurate enough to trust. The result: a 2.75-gigapixel map of Gandhinagar with every OpenStreetMap building, four climates and living night traffic.
Challenge 01
How do you render a 2.75-gigapixel image on an 8 GB laptop?
The problem
A 58,368 × 47,104 px image cannot be rendered or even held in memory in one pass.
How we solved it
- Split the city into 154 regions of 4 × 4 chunks under one fixed orthographic camera.
- Rendered each region separately in headless Chrome with three.js: 4–9 seconds each, peak memory under 1.6 GiB.
Challenge 02
How do you hide the seams between separately rendered regions?
The problem
Shadows, trees and buildings that cross a region edge rendered differently on each side, leaving visible lines.
How we solved it
- Gave every region a 260 m margin so neighbours and shadows are present.
- Locked shadows to one world-anchored texel grid shared by all chunks.
- Measured: 99.3% of pixels identical to a single continuous render.
Challenge 03
How do you serve a gigapixel map smoothly on any device?
The problem
Standard tools build the full image before cutting tiles, which was impossible at this size.
How we solved it
- Wrote a chunk-native Deep Zoom builder that makes each zoom level from the level below, byte-identical to libvips output.
- Served 17 zoom levels of 512 px WebP tiles through OpenSeadragon.
Challenge 04
How do you prove an illustration matches the real city?
The problem
Pretty maps are easy; trustworthy ones need measurement and honesty about what is invented.
How we solved it
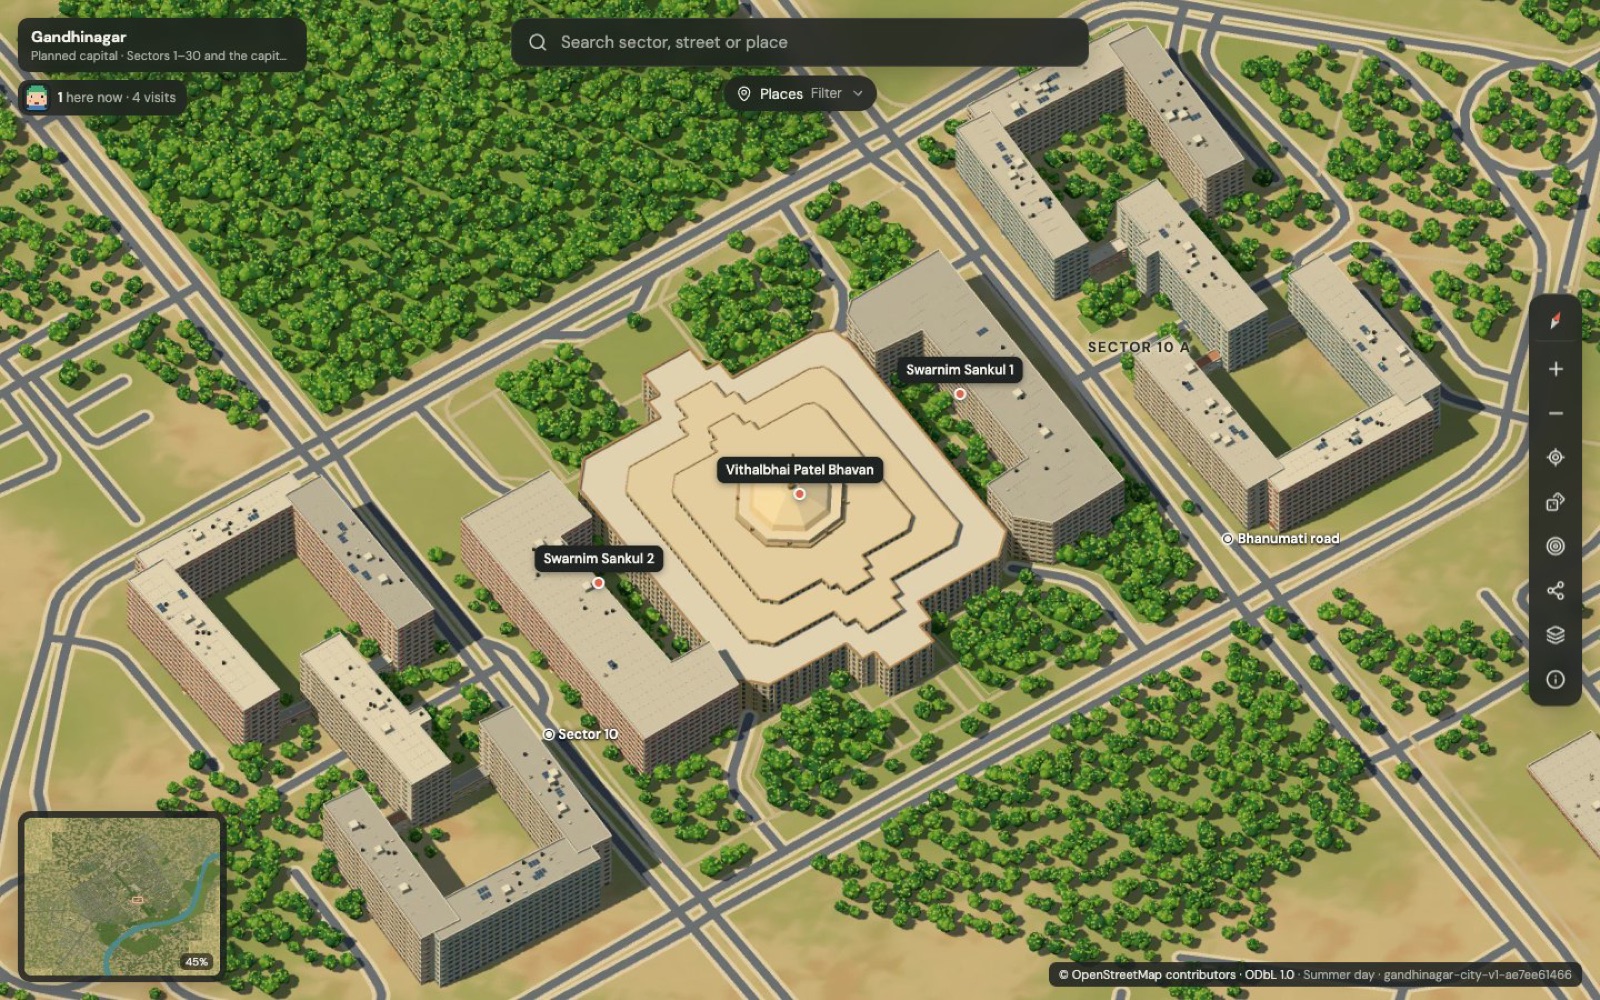
- Automated fidelity checks: 100% of OSM buildings and 99.5% of roads drawn at their real footprint, with 0.000 px round-trip error.
- Compared against an independent satellite survey (median 6.7 m agreement).
- Documented clearly which details are illustration, such as facades and individual trees.
Challenge 05
How do you make a static picture feel alive without slowing it down?
The problem
Animating a gigapixel image directly would be far too heavy.
How we solved it
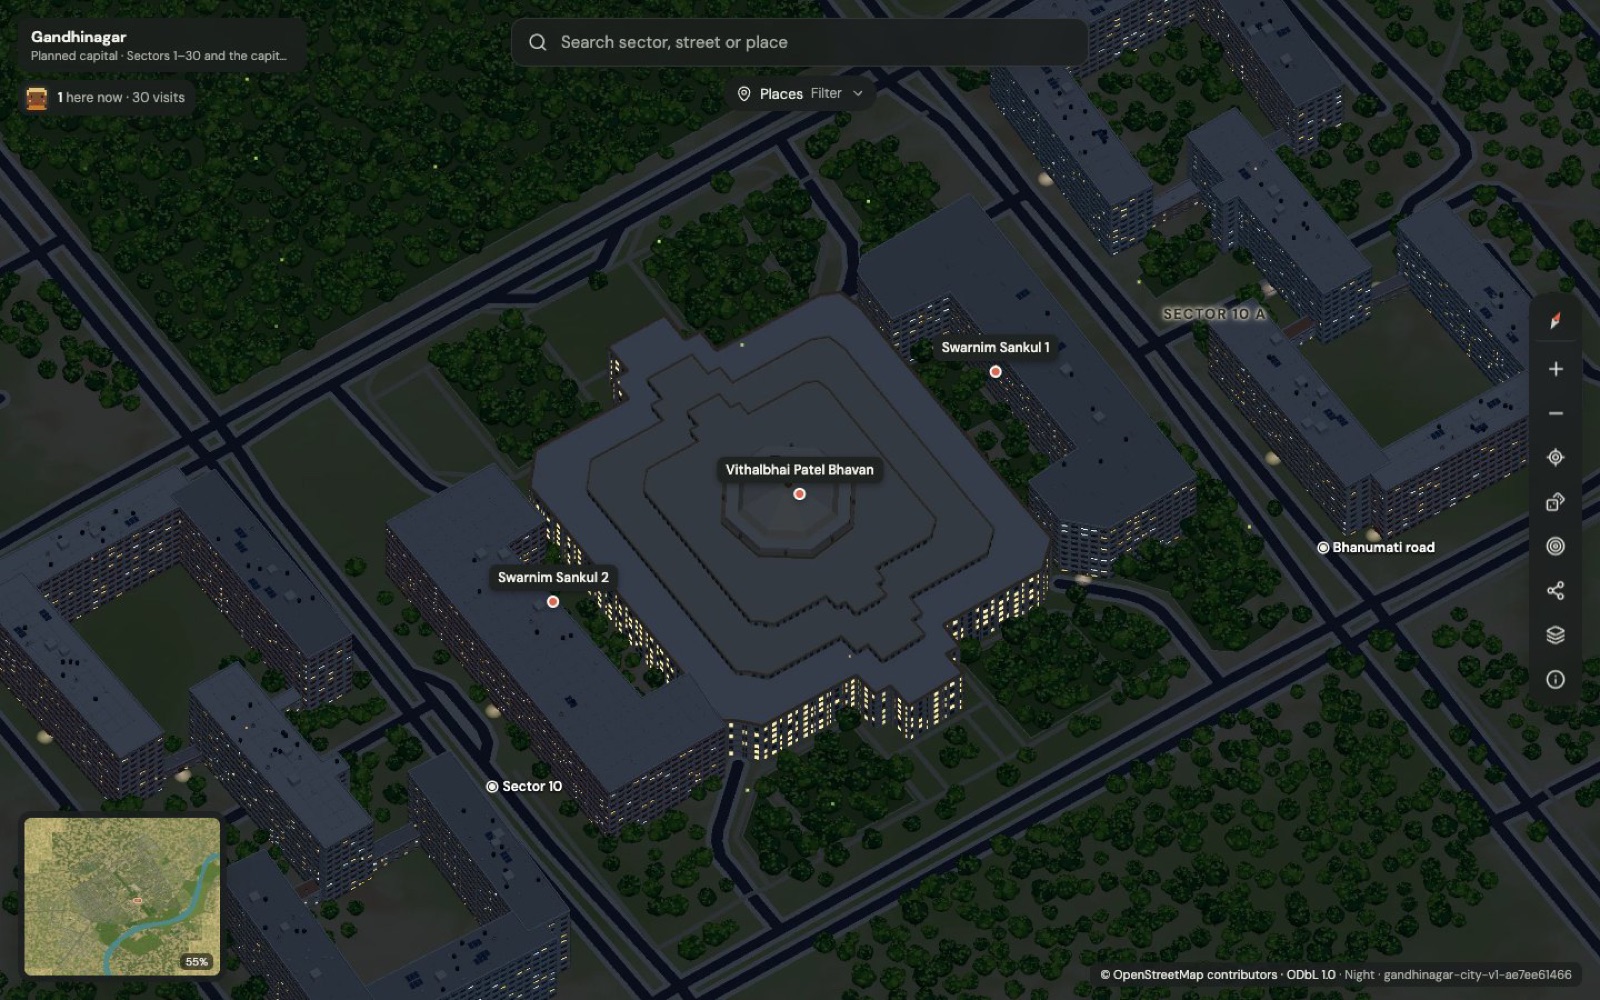
- Drew night traffic, metro trains, lamps and fireflies on a lightweight canvas overlay above the static tiles.
- About 20,000 cars on real roads at under 30 fps, roughly 1–2 ms per frame, paused in hidden tabs and for reduced motion.
Results & lessons
What it delivered, and what we would do again
Indian Pixel City is live and open source on GitHub. The same pipeline can map any city with good open data, for tourism, smart-city portals, real estate or education.
- Split huge problems into regions with shared margins.
- Measure accuracy, and say what is illustration.
- Animate in an overlay, not in the heavy layer.
Quick answers
Indian Pixel City at a glance
What is Indian Pixel City?
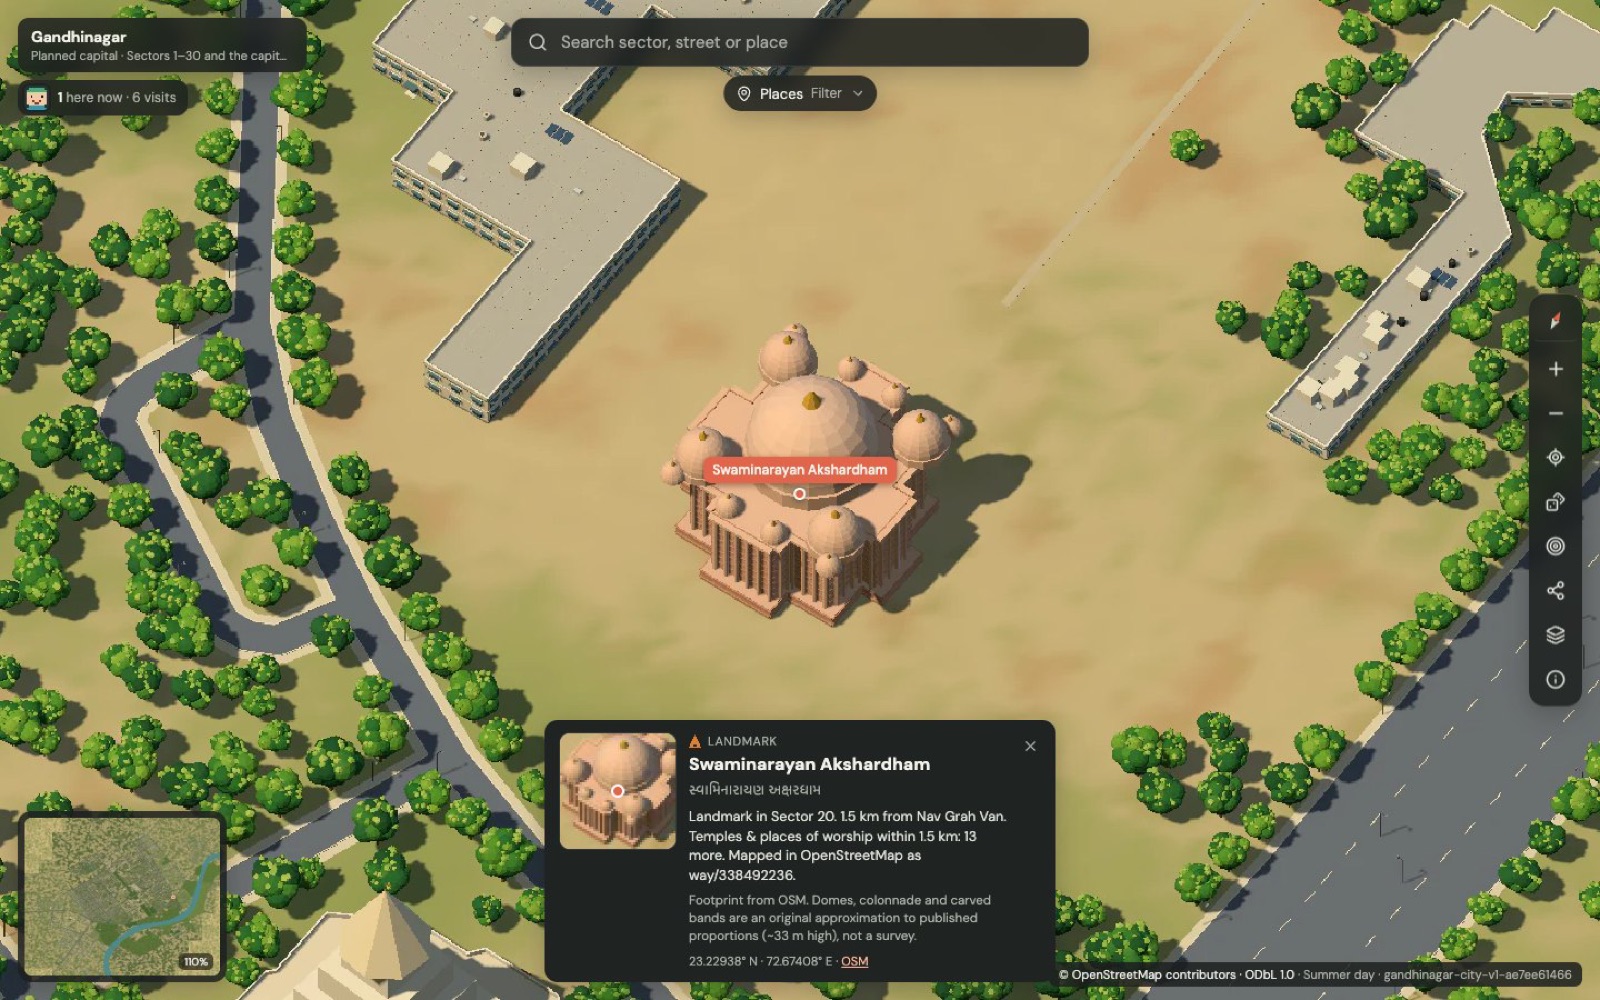
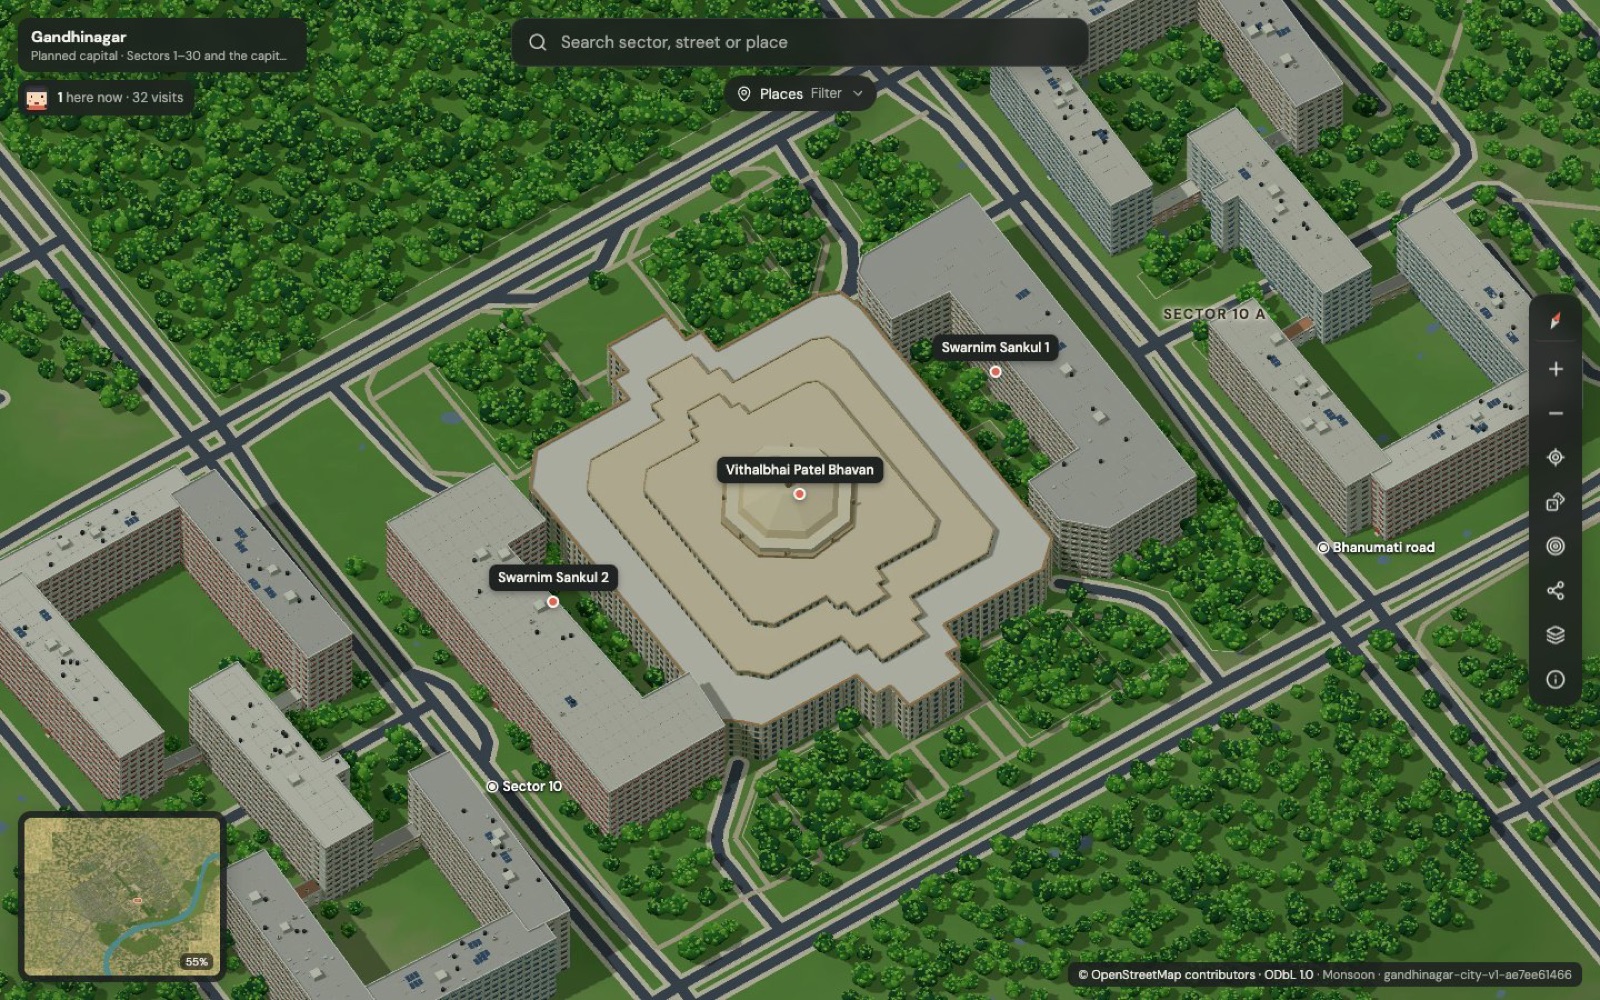
Indian Pixel City is an illustrated, explorable map of Indian cities built from open data. The first city is Gandhinagar, Gujarat's capital: every mapped building, road, park and lake across 61 km² is drawn at its real position in a fixed bird's-eye view you can zoom from the whole city to a single temple roof.
How accurate is the map?
All 25,969 above-ground OpenStreetMap buildings and 99.5% of roads are drawn at their real footprint, with zero round-trip error between map pixels and geography. Facades, rooftop details and individual trees are authored illustration, and the project documents exactly which parts are measured and which are illustrated.
What can visitors do on the map?
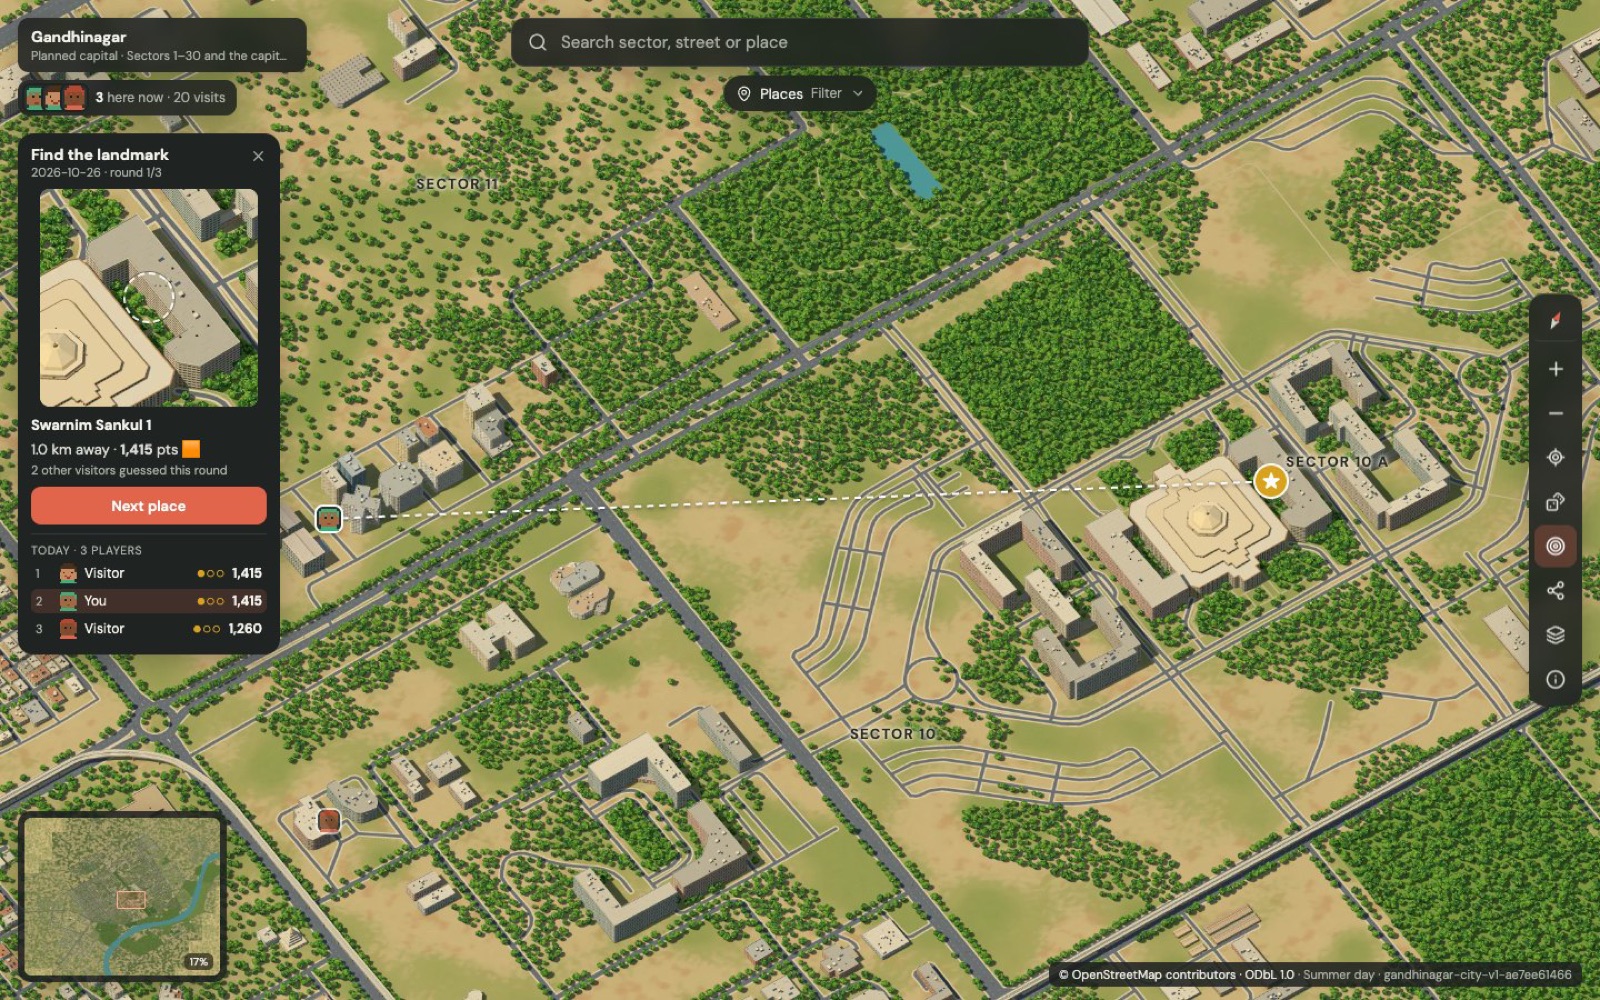
Switch between summer, monsoon, winter and night; search in English or Gujarati; filter 16 kinds of places such as hospitals, petrol pumps and metro stations; open place cards; follow a random landmark tour; and play a daily find-the-landmark game. At night, traffic flows on real roads and metro trains run between real stations.
What technology does it use?
OpenStreetMap data processed into a single orthographic render with three.js in headless Chrome, region by region, then cut into Deep Zoom tiles. The viewer is React with OpenSeadragon, with an animated canvas overlay for night and weather, deployed on Cloudflare Workers.

Next step
Tell Us Your Problem. We'll Help You Build the Solution.
Tell us what you are working on. You will get a considered reply from an engineer — with questions, a suggested approach or an honest “we are not the right fit”.